 Blog Entry | September 21, 2015
Successful Insights of Wireless Electricity Measures
September 21, 2015
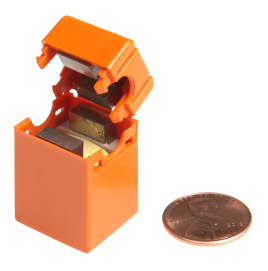
It’s been just under a year of using our low-cost device level wireless sensors (Panoramic Power) in various facilities, and I wanted to share the successful insights we’ve gleaned from our experiences. The results are better than we anticipated!
 On average, we are generating over 10% immediate kWh reduction from simple non-capital intensive measures, and in one case, the awareness of the BAS not accurately presenting units on when they were listed as off, produced an immediate kWh reduction of over 15% from one measure.
As a recap, typical industry practices are to capture existing disparate data points for a facility (such as utility meter data, BAS data), and generate recommendations around the optimization of the HVAC system. Yes. You absolutely will have a finely tweaked HVAC system.
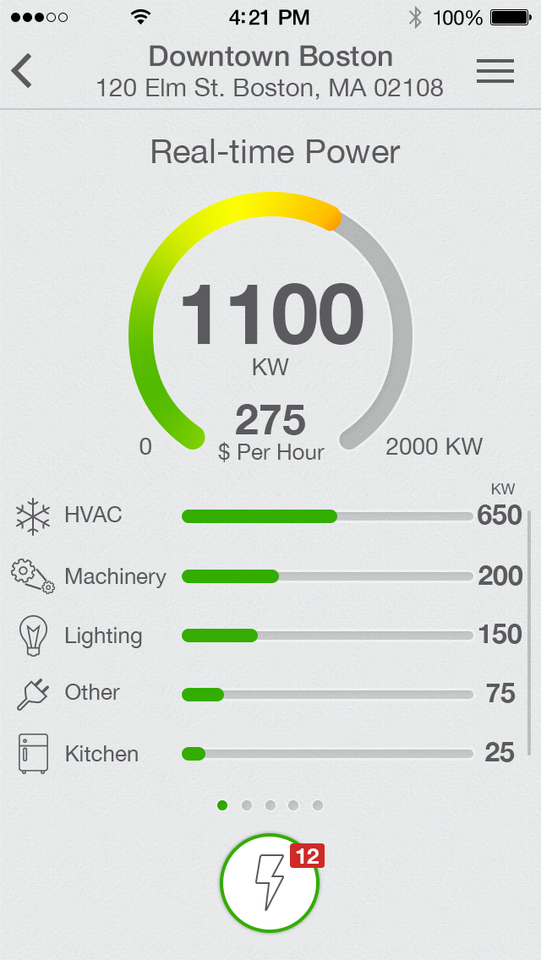
This is where SustainCo believes that approach is key, and only assessing 40% of the electrical use, is no solution. We look at 100% of the electrical load, which includes the 6 electrical systems of HVAC (3) and lights, plugs and processes. These 3 additional systems typically account for 60%+ of the demand load by human behaviour, and when you are able to drill down and measure those loads by system (or device) and overlay their electricity costs, you’re able to make better recommendations because you have more data points to fill in the load story of the facility. It’s just common sense that more data inputs will lead to better recommendations. Garbage in, garbage out.
SustainCo takes this evidence-based data to drive non-capital intensive measures.
Now, you’re caught up.
Facility Types
SustainCo has designed and/or installed system level measures in a number of types of facilities and gleaned various insights.
Mid-rise commercial; commercial; institutional; industrial; restaurant; school; university; social housing; apartments; condos; car dealership; cold storage facility, retail
Here’s what we learned:
1. SustainCo “approach” leads to lower capital expenditures for maximum energy efficiency
Our “approach” leads towards lower capital costs to generate maximum energy efficiency. We generate immediate kWh reductions by focusing on non-capital intensive recommendations first.
As an example, typical industry proposal for a controls package in student apartment residences is almost double as expensive as our proposed wireless controls package once we let the evidence-based measures drive recommendations
2. Wireless is more cost effective than wired
A customer ran a bidding process where we were able to demonstrate that the capital cost of the wireless system and installation was roughly ¼ the capital cost of the comparative wired metered solution. By the way, the wired metered solution didn’t include installation of Cat5 cables and required construction.
The advancements in Wi-Fi technology specifically, 802.11n/s enables meshing. I can understand why the OEM BAS industry try to minimize the use of wireless; they are trying to protect their monolithic BACnet system that Wi-Fi completely undermines.
Imagine that today you can install wireless monitoring and control equipment using 802.11n/s and using an HTML5 website to monitor and control. There is no need for the complicated proprietary equipment in between.
You’ll experience more of this in the coming year.
3. Building automation systems are often embarrassingly wrong
Shouldn’t a BAS be accurate in identifying equipment that should be off, but in actuality, is on?
Shouldn’t a BAS building vs a non-BAS sister-building have a better energy curve?
It’s not lost on the industry that many BAS are overridden by staff, or that these systems are not optimized and not often enough, but the reality is that while a BAS enables the ability to control a number of devices and equipment, who or what should direct it?
Shouldn’t the evidence-based data drive the required recommendations and controls and settings, and then you utilize the BAS to execute?
If nothing else, after spending significant amount of money on a sophisticated BAS, our wireless monitoring system validates and audits the actual energy use- demand load- so that you can better direct and optimize your system.
We’ve seen examples where over 300 fan boxes were listed as off in off-peak hours in a facility, but our sensors proved that they were never going off. Up until someone literally turned off circuits to prove it, the site BAS manager was adamant that they were off. This is common.
4. Customers are more open to change than their energy management vendors
I haven’t been in a meeting yet where a potential customer didn’t ask within minutes into the meeting, to measure systems in their facility(ies). Their existing energy management advisors don’t like change.
The industry still thinks of energy efficiency as tweaking and optimizing HVAC systems, but as we now know, that only accounts for roughly 40% of the electrical load of facilities, and they don’t believe that the other 60% of human behaviour- lights, plugs and processes- can be legitimately affected.
We are affecting human behaviour!
Customers have never really known the cost of leaving lights on during off peak hours or the impact of starting exhaust fans and other equipment when not needed. Now they do, and when presented with these facts, customers (who pay those bills) appreciate the accuracy and affect change in behaviour.
5. Customer’s energy managers feel threatened, but they shouldn’t
In the cases where prospective customers are more sophisticated managers, we’ve seen some backlash and certainly appreciate that those individuals and BAS teams and utility bills teams feel threatened by our approach.
But I would say this. It is completely understandable that these individuals and teams feel that they’re doing the best they can, because they are quite typically making recommendations and reacting to data that only demonstrates either 40% of the bill or the aggregated 100% of the bill with no context.
Until recently, there was no cost effective measure to monitor drilled down demand user data. It’s not their fault. But, we’re walking in and can argue that we see potential for between 20% and 30% kWh reduction can certainly make staff feel uneasy. With more data points, staff can make different decisions than previously. There weren’t doing it wrong before; they just didn’t have the data.
Now that they can have the data, they can make different decisions, and our own approach is to support them as coaches and advisors and generate recommendations along with them. We can make them champions within their organizations. In examples where staff get their back up and defend their approach and fight the need for these wireless devices, I’ve only seen embarrassment in their outcomes.
6. Customers will change Human Behaviour when shown evidence-backed data
All customers of our wireless measuring system have had recommendations of non-capital intensive human behavioral changes.
For example, despite espresso machines being turned off after hours, we know that the steam boilers run around the clock, adding significant unintended demand loads.
We know that restaurant owners can easily change their restaurant open process that lead to over 40% of their energy use occurring when they’re not open. For example, staff are instructed to turn on exhaust fans well before required, which then cause make up air and other heating and cooling systems to pick up to maintain temperature, when no revenue is being created.
We see that plug loads are running charging equipment in industrial facilities with no on/off coordination.
Staff must have competency to be able to change their behaviour once they know the negative impacts of their actions. Items should only be on when they’re intended to be on.
7. Customers confuse similar energy curves from similar sites as being good
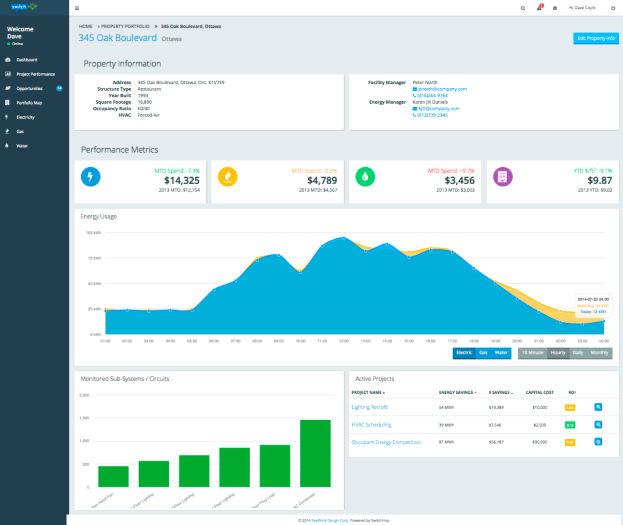
but the underlying assumption is that the non-outliers are working within some kind of normal energy curve band, well, because they’re fairly
similar curves. This is a reasonable expectation without additional data, but with the disaggregation of the energy curve into the six electrical systems, one can see the energy efficiency opportunities within those similar energy curves, and see that there can still be significant reductions.
Call to Action
We will continue to create tremendous insights for the full range of customers.
We have enjoyed our strategic partnerships with SeeWind Design and Panoramic Power to bring this solution to market, and we continue to improve and automate our abilities to spit out insights from evidence-based data.
Going forward, we’re excited to work with organizations that want to lead their market segment in creating the most energy efficient facilities vs their counterparts. Let’s change human behaviour together!
Thank you,
Thought leader on sustainability, energy efficiency and clean energy
Twitter @fcarnevale